Output Visualizations
View enrichment of tissue-specific gene expression
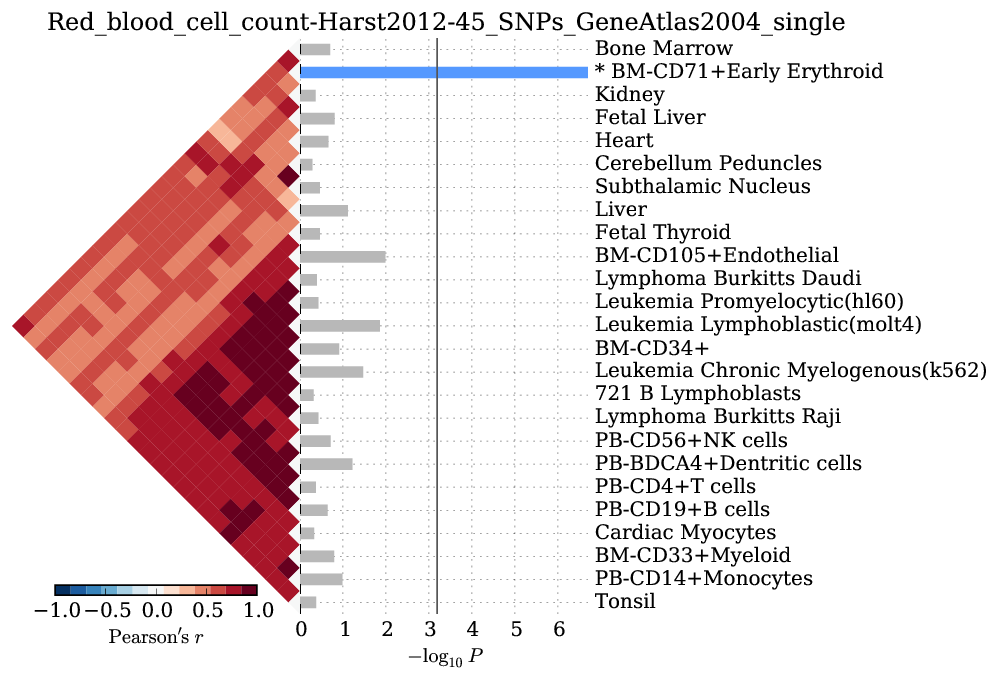
A horizontal bar plot of negative log10 p-values for a test of 45 red blood cell count-associated SNPs for enrichment of tissue-specific expression in profiles of 79 human tissues and cells.
python bin/snpsea-barplot out
View the most specifically expressed gene for each SNP-tissue pair
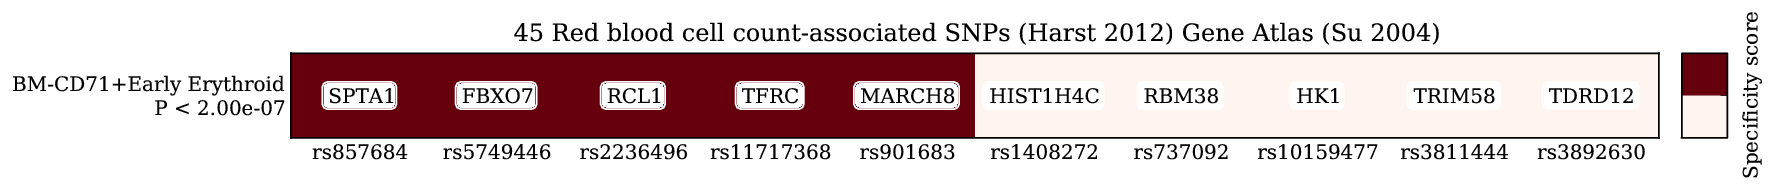
A heatmap exposing the contributions of specifically expressed genes within each SNP linkage interval to the specificity scores of each tissue.
python bin/snpsea-heatmap out
View the type 1 error rate estimates for each tissue
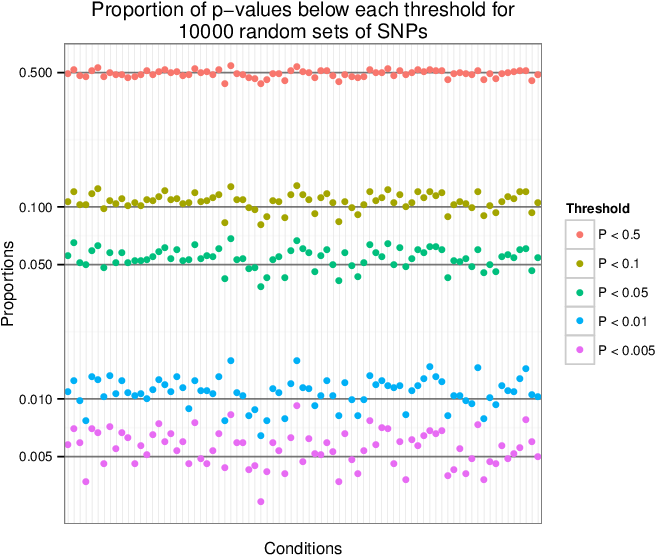
A scatter plot of the observed proportion of p-values under various thresholds after repeating the analysis with 10,000 random SNP sets.
Rscript bin/snpsea-type1error out