Visual Summary
Cartoon
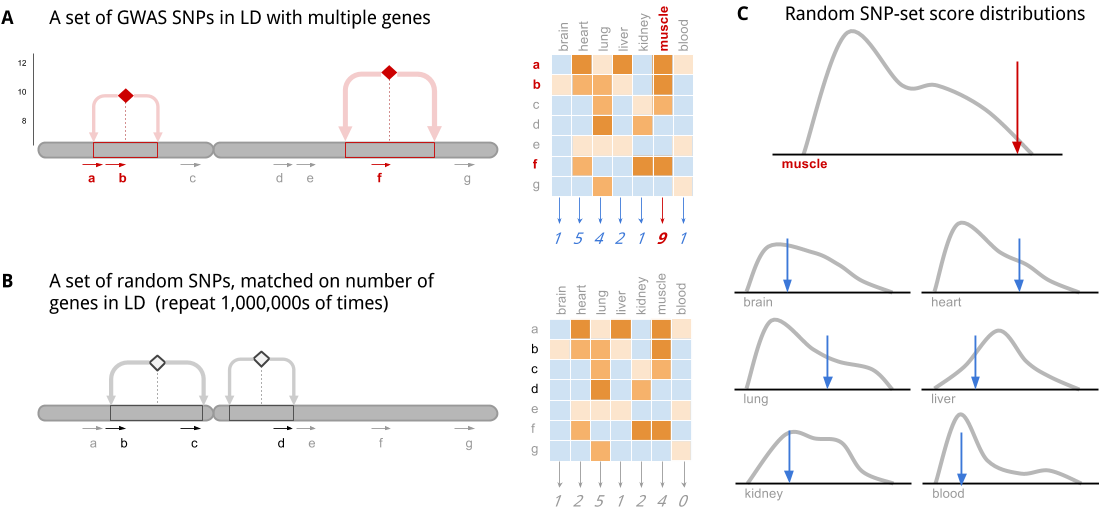
This cartoon illustrates the key ideas of the algorithm:
A| Step 1. Each SNP in a set of disease-associated SNPs is in linkage disequilibrium (LD) with multiple genes. The genes are scored, in aggregate, for specificity to each tissue.
B| Step 2: The algorithm is repeated with random null SNP sets that are not associated with any phenotype. These have been selected from an LD-pruned list of SNPs, so the whole genome is covered.
C| Step 3: The random SNP set scores form the null distributions which allows us to determine statistical significance for enrichment of specificity to a particular tissue/cell-type/condition.
Flow Chart
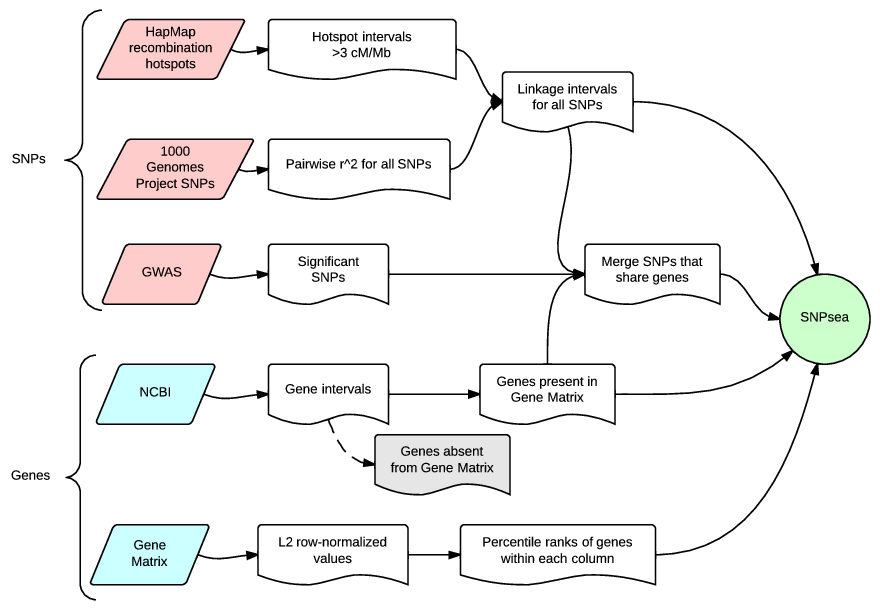
This flow chart shows the input data required to perform the analysis, and a summary of the intermediate steps.