Supplementary Figures
Supplementary Figure 1: Determining SNP linkage intervals
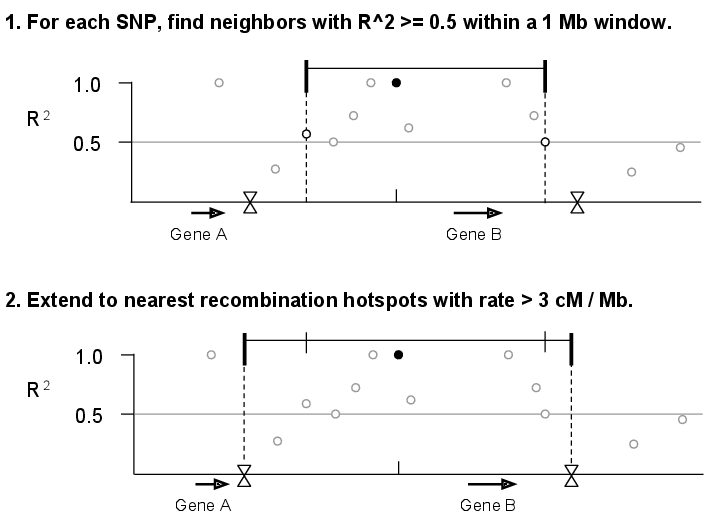
We calculated \(r^{2}\) values for all pairs of SNPs within a 1 Mb sliding window along each chromosome. Next, we assigned each of the SNPs from The 1000 Genomes Project Phase I (1000 Genomes Consortium 2012) to a linkage interval by identifying each SNP’s furthest upstream and downstream neighbors with \(r^{2}\ge0.5\). Finally, we extended each interval to recombination hotspots reported by HapMap (Myers et al. 2005) with recombination rate >3 cM/Mb.
Supplementary Figure 2: Counting genes in GWAS SNP linkage intervals
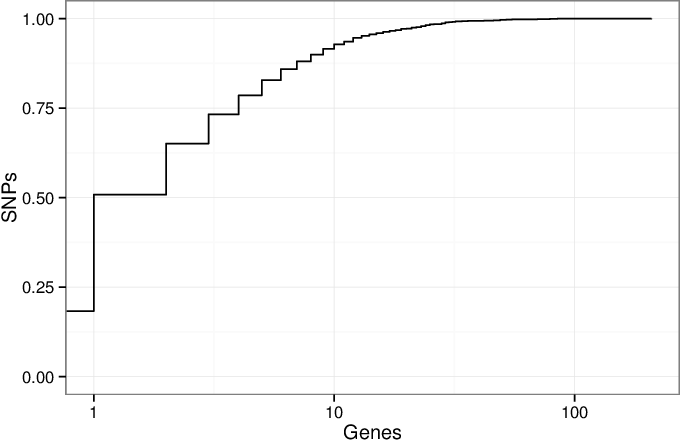
A cumulative density plot of the number of genes overlapped by the linkage intervals of GWAS SNPs. We downloaded the GWAS Catalog SNPs on January 17, 2014 and selected the 11,561 SNPs present in the 1000 Genomes Project (1000 Genomes Consortium 2012). Of these SNPs, 2,119 (18%) of them have linkage disequilibrium (LD) intervals that overlap no genes, and 3,756 (32%) overlap a single gene. The remaining 50% of SNPs overlap 2 or more genes. This illustrates the critical issue that many SNPs implicate more than one gene.
Supplementary Figure 3: Choosing the \(r^{2}\) threshold for linkage intervals
We chose to use \(r^{2}\geq0.5\) due to previous experience (Rossin et al. 2011). To investigate if this choice influences SNPsea results, we repeated the analysis of 45 red blood cell count-associated SNPs (Van der Harst et al. 2012) using 5 different thresholds (\(r^{2}\ge\) 0.2, 0.4, 0.6, 0.8, 1.0). We also did this for SNPs associated with multiple sclerosis, celiac disease, and HDL cholesterol.
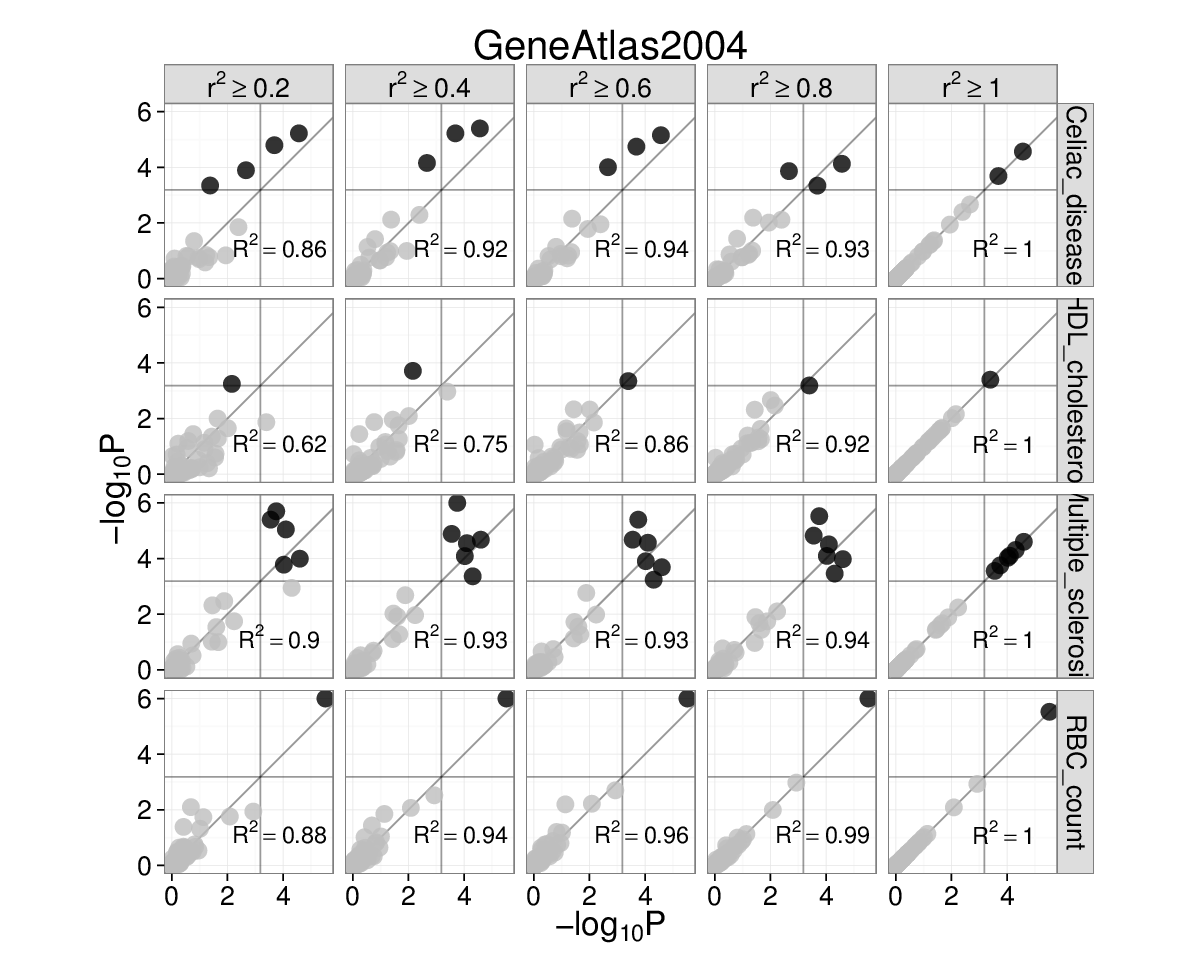
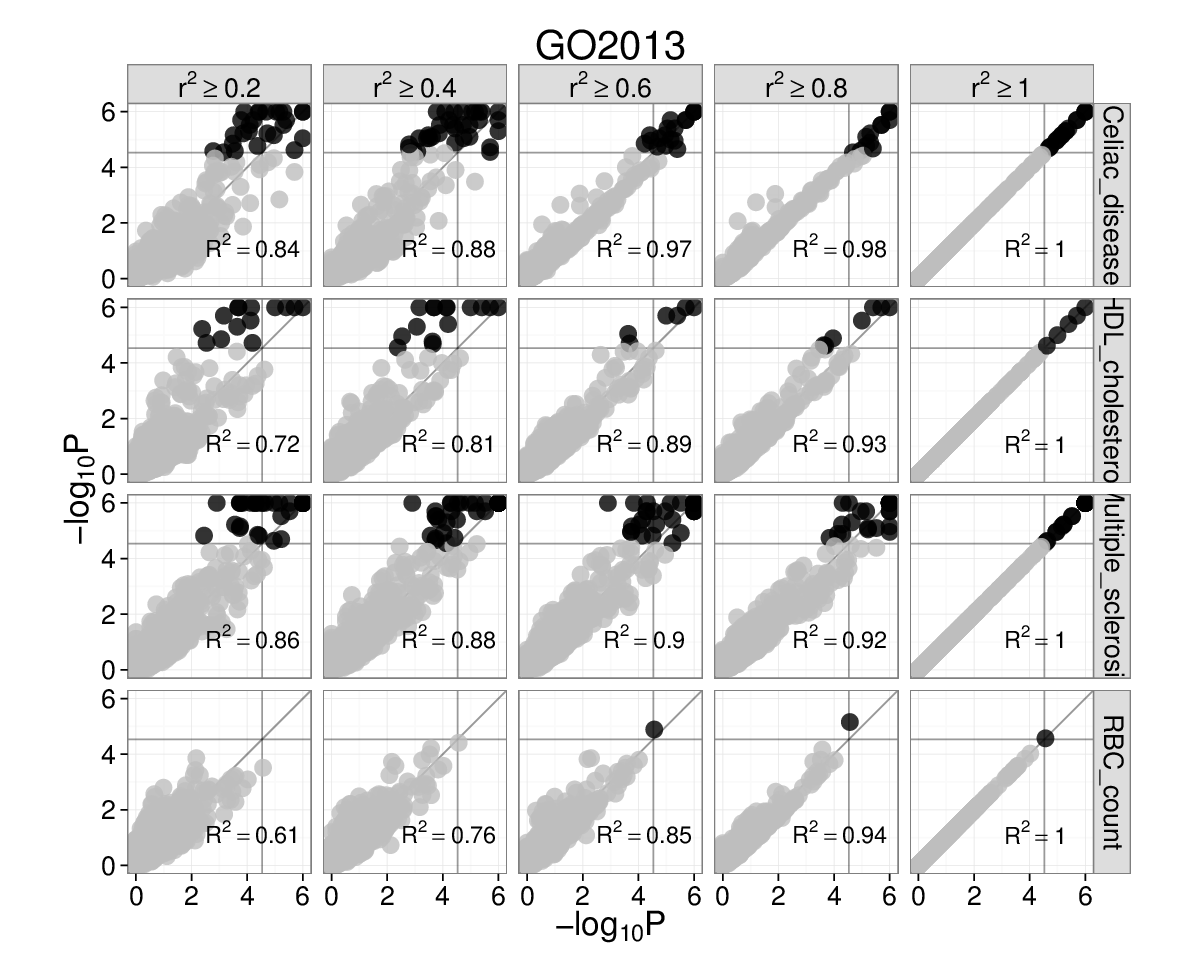
Gene Atlas and Gene Ontology (left and right). Each subplot has
\(-\text{log}_{10}P\) for \(r^{2}=1\) on the x-axis and
\(-\text{log}_{10}P\) on the y-axis for the \(r^{2}\) threshold
marked above. Grey lines are significance thresholds after correction
testing multiple conditions (cell types, GO annotations). Black points
are significant and grey are not. We used the ’--score single’
option. Red blood cell count SNPs are enriched for hemopoiesis
(GO:0030097) (\(P=2\times10^{-5}\)) for linkage intervals with
\(r^{2}=(0.6,0.8,1.0)\). This result falls below the multiple
testing threshold at \(r^{2}\ge0.4\), but remains significant at
\(r^{2}\ge0.5\) (see main text).
Supplementary Figure 4: Each trait-associated locus harbors a single associated gene
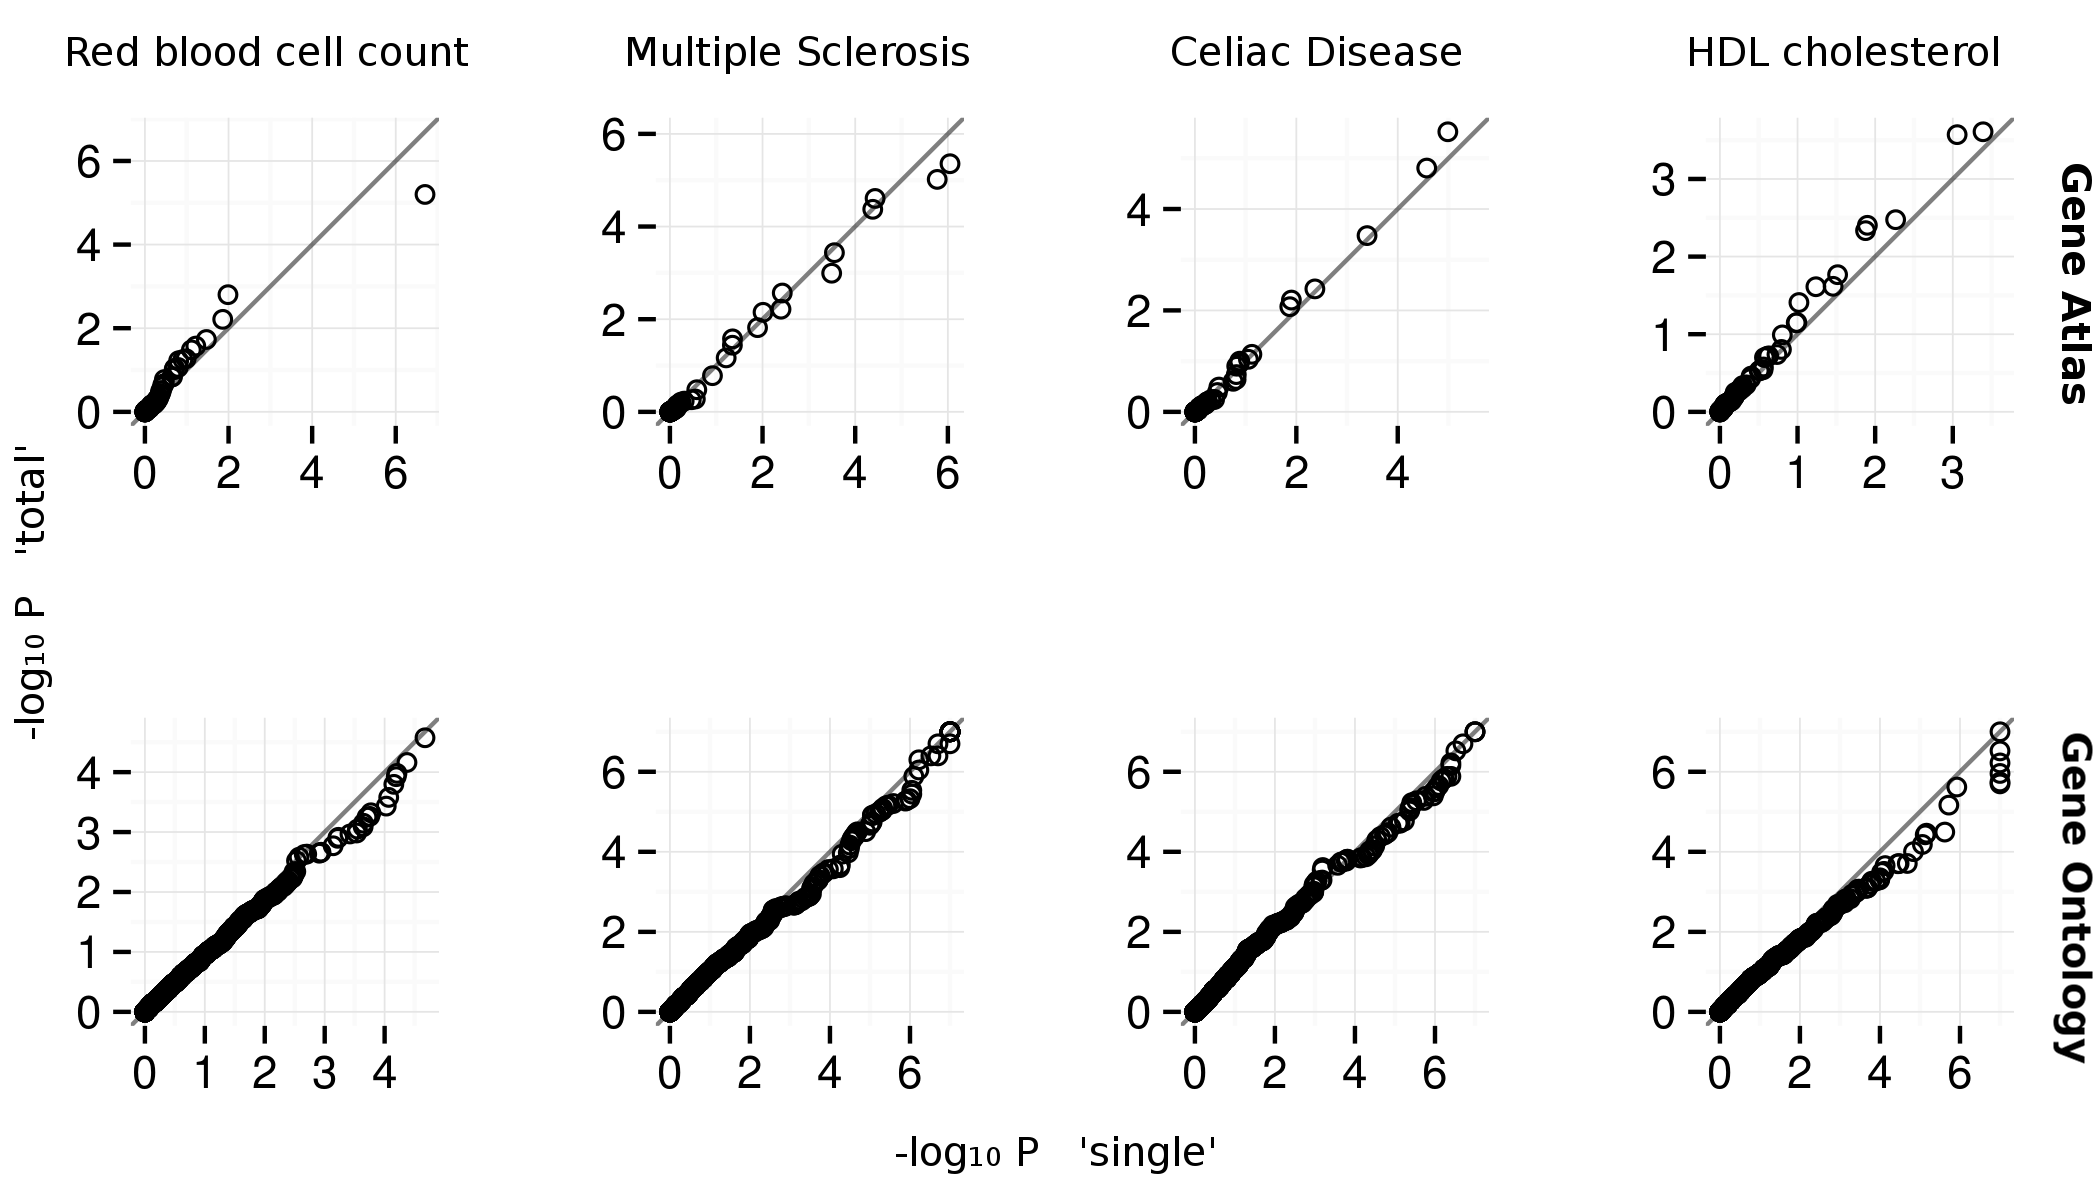
Quantile-quantile plots for Gene Atlas (Su et al. 2004) and Gene
Ontology (top and bottom). The x and y axes are
\(-\text{log}_{10}P\) for ’--score single’ and ’--score total’
SNPsea options, respectively. The ’single’ and ’total’ methods
are described . The \(P\)-values appear similar between methods.
Supplementary Figure 5: Type 1 error estimates
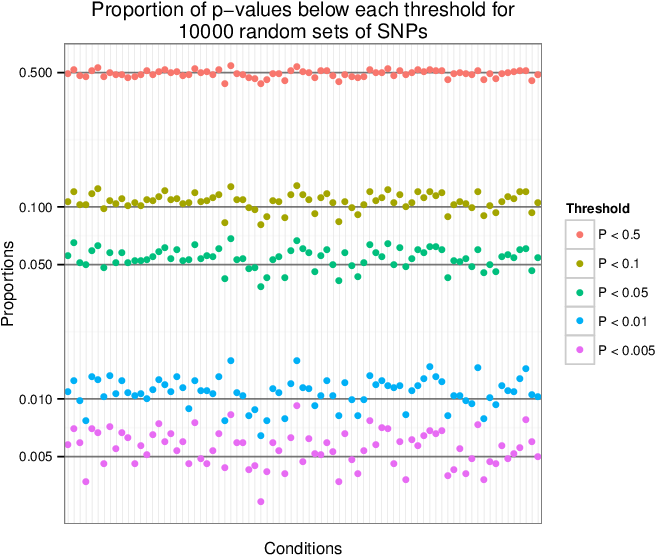
We sampled 10,000 sets of 100 SNPs uniformly from a list of LD-pruned SNPs (Lango Allen et al. 2010). We tested each of the 10,000 sets for enrichment of tissue-specific expression in the Gene Atlas (Su et al. 2004) gene expression matrix (top) and for enrichment of annotation with Gene Ontology terms (bottom). For each condition, we show the proportion of the 10,000 enrichment p-values that are below the given thresholds. We observe that the p-values are near the expected values, so the type 1 (false positive) error rate is well-calibrated.
Additional Examples
We tested SNPsea with the three additional phenotypes listed below with
genome-wide significant SNPs \((P\leq5\times10^{-8})\). When
multiple SNPs implicated the same genes, we merged them into a single
locus. We tested each phenotype with the Gene Atlas and GO matrices with
the ’--score single’ option. The adjacent heatmaps show Pearson
correlation coefficients for all pairs of conditions.
| Phenotype | SNPs | Loci | Reference |
|---|---|---|---|
| Multiple sclerosis | 51 | 47 | Supp. Table A (IMSGC WTCCC 2011) |
| Celiac disease | 35 | 34 | Table 2 (Trynka, et al. 2011) |
| HDL cholesterol | 46 | 46 | Supp. Table 2 (Teslovich, et al. 2010) |
Supplementary Figure 6: Red blood cell count GO enrichment
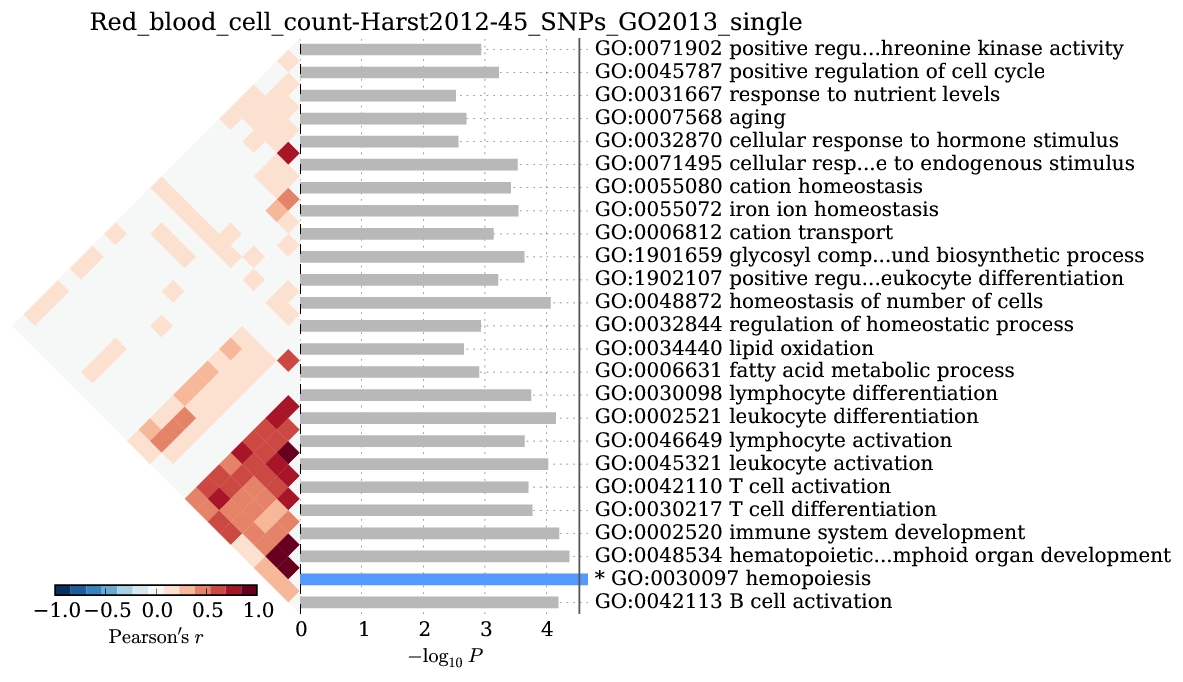
We observed significant enrichment for hemopoiesis \((2\times10^{-5})\). The top 25 terms are shown.
Supplementary Figure 7: Multiple sclerosis
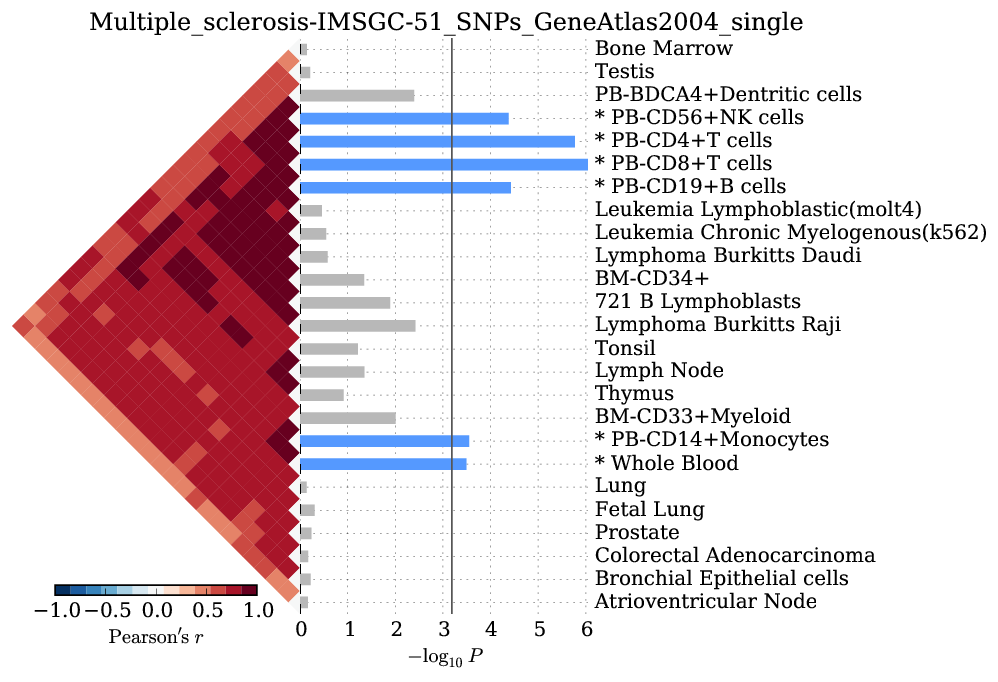
We observed significant enrichment for 6 cell types. The top 25 of 79 are shown.
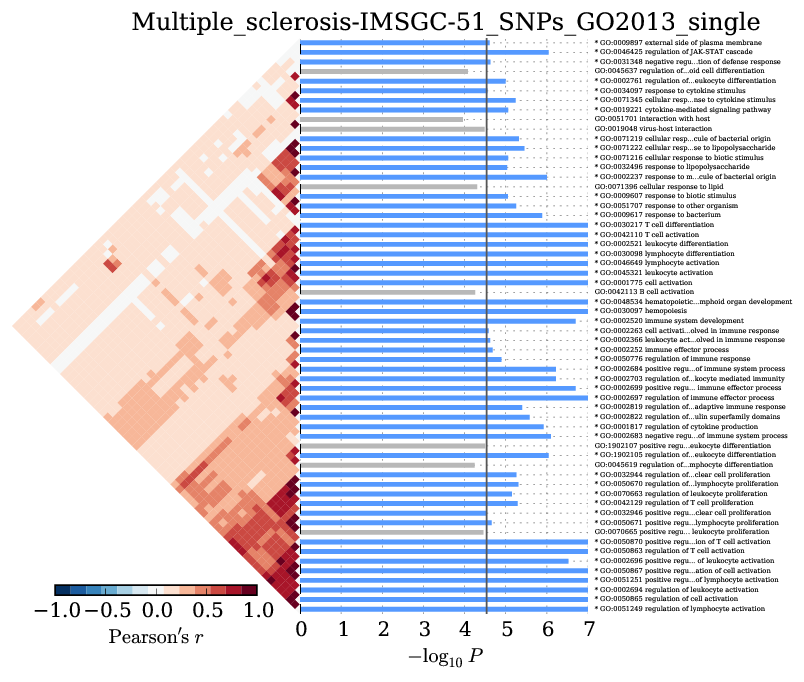
We observed significant enrichment for 52 Gene Ontology terms. The top 60 terms are shown.
Supplementary Figure 8: Celiac disease
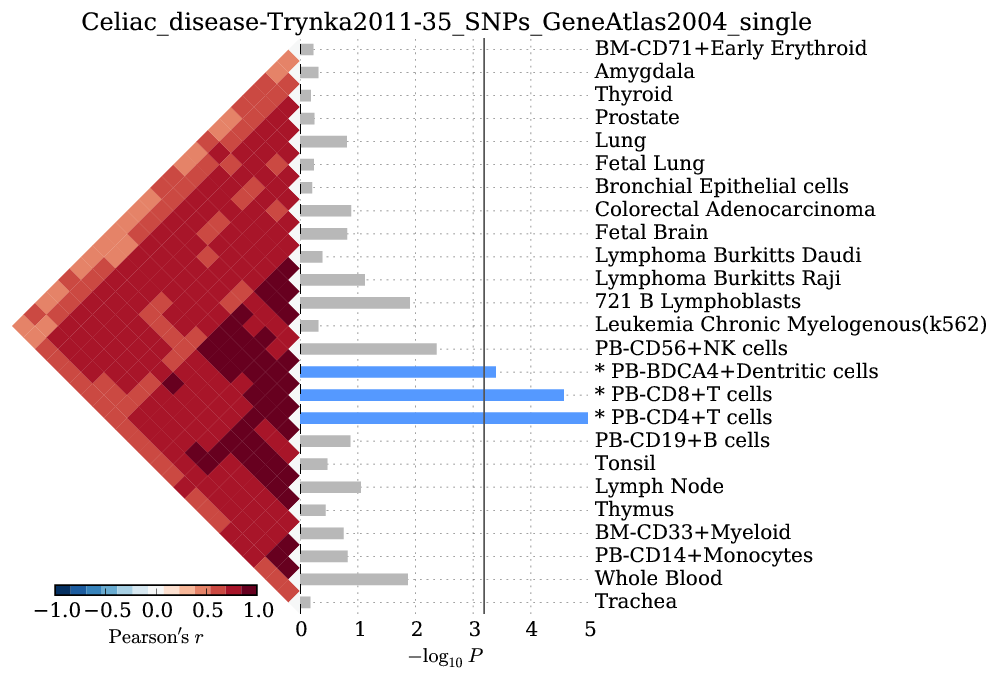
We observed significant enrichment for 3 cell types. The top 25 of 79 are shown.
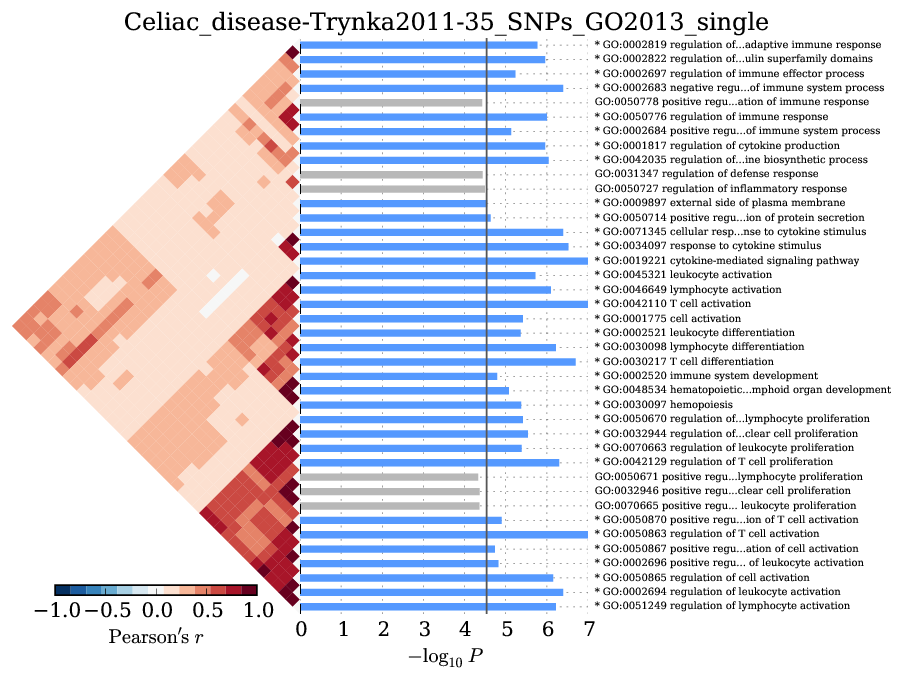
We observed significant enrichment for 28 Gene Ontology terms. The top 40 terms are shown.
Supplementary Figure 9: HDL cholesterol
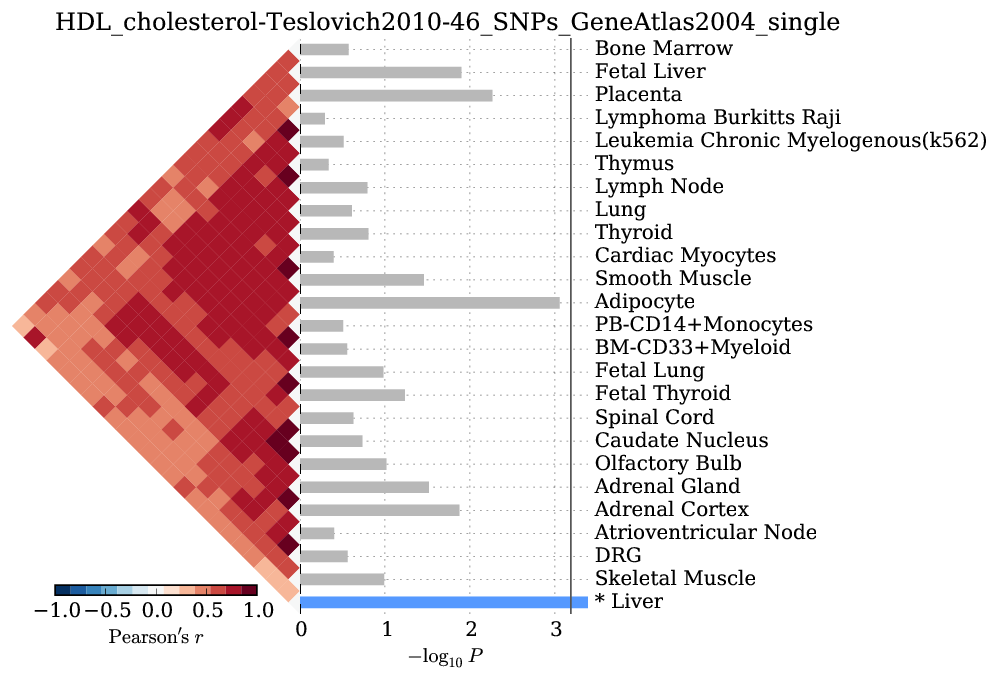
We observed significant enrichment for liver tissue-specific gene expression. The top 25 of 79 are shown.
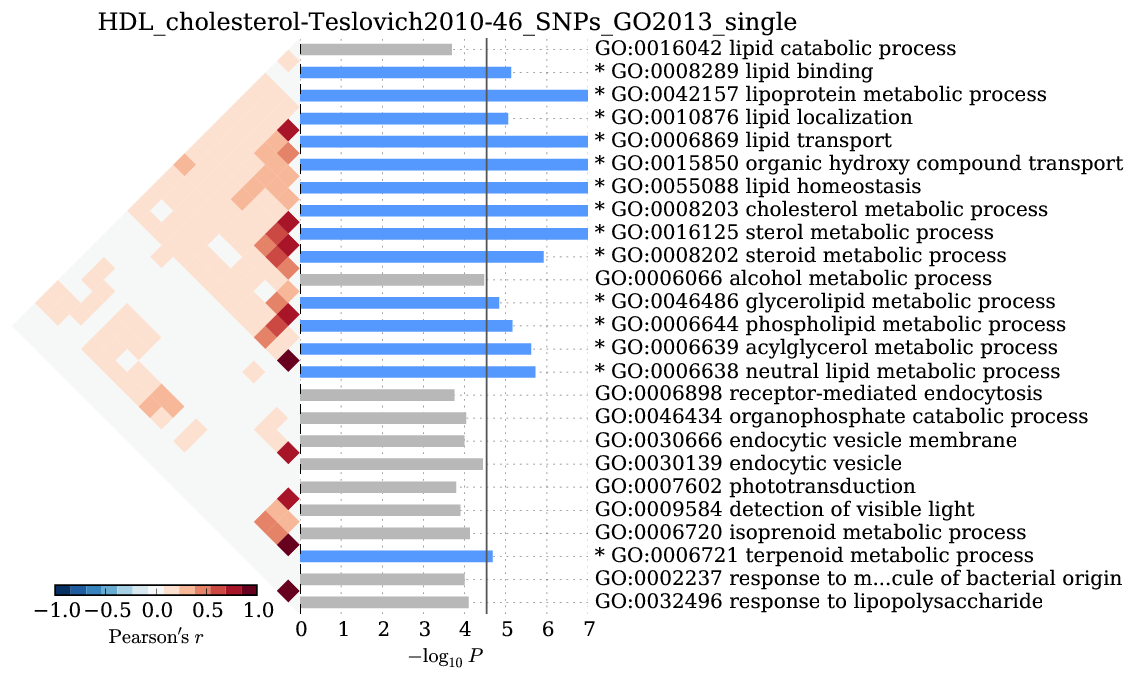
We observed significant enrichment for 13 Gene Ontology terms. The top 25 terms are shown.